Serum superoxide dismutase level is a potential biomarker of disease prognosis in patients with hemorrhagic fever with renal syndrome caused by the Hantaan virus - BMC Infectious Diseases - BMC Infectious Diseases
Clinical typing and demographic characteristics of HFRS patients
A total of 149 HFRS patients were included in the present research. According to the HFRS clinical categorization criteria, among the enrolled patients, there were 64 mild, 21 moderate, 6 severe, and 58 critical patients. Moreover, of the 58 critical HFRS patients, 46 survived and 12 died with a hospital mortality rate of 20.68%. The clinical baseline characteristics of HFRS patients of different clinical types and controls are shown in Table1.
Levels of SOD in patients with HFRS
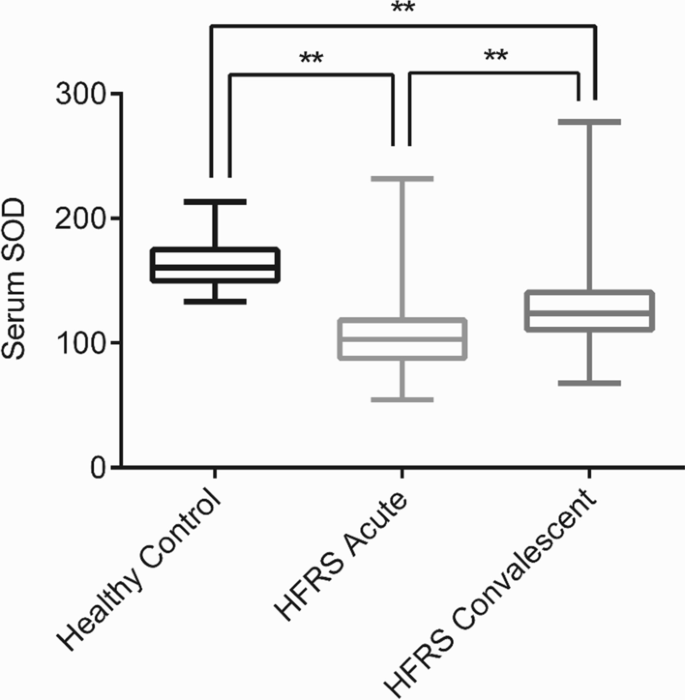
SOD levels in both acute and convalescent stage patients were substantially lower than those in healthy controls (acute: 108.40 ± 2.47 U/mL vs 164.23 ± 3.82 U/mL, P < 0.01; convalescent: 138.27 ± 2.87 U/mL vs 164.2 ± 3.82 U/mL, P < 0.01), while SOD levels in the acute stage were lower than those in the convalescent stage (Fig. 1). We then focused on the initial blood samples acquired from HFRS patients during admission in the acute stage. We examined the effects of age and gender on SOD concentration. We found that 76.5% of HFRS patients were male and 23.5% were female. The age range of patients with HFRS ranged from 10 to 70 years. The concentration of SOD in patients with HFRS did not significantly differ among age groups or genders (supplement data, S1 Fig).

Serum SOD levels in HFRS patients. Comparison of serum SOD in healthy controls and patients with HFRS at acute and convalescent stage. **P < 0.01
Levels of SOD are associated with disease severity in patients with HFRS
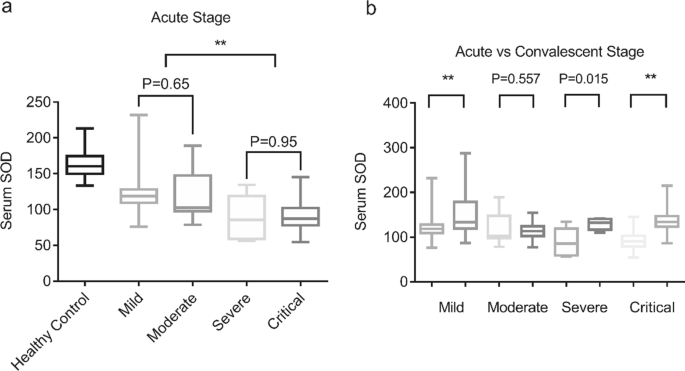
The median serum concentration of SOD in healthy individuals was 1.6-times higher than that in HFRS patients. The serum levels of SOD were then compared among HFRS patients in different groups. Serum SOD levels were considerably lower in the critical group or the severe group of HFRS patients than in the moderate or mild groups, indicating that serum SOD levels may be linked to disease severity in HFRS patients. No significant differences in SOD levels were found between mild and moderate forms (123.37 ± 3.46 U/mL vs 119.98 ± 7.56 U/mL, P = 0.65) or between severe and critical forms (89.13 ± 12.69 U/mL vs 89.68 ± 2.33 U/mL, P = 0.95) (Fig. 2a). With the disease remission, serum SOD levels significantly increased in the mild, severe, and critical groups (Fig. 2b).

Serum SOD levels in HFRS patients in different groups. a Comparison of serum SOD in healthy controls and patients with HFRS according to the clinical course of the disease; b Comparison of serum SOD in patients with HFRS at acute and convalescent stage in mild, moderate, severe and critical groups. **P < 0.01
Serum SOD levels are associated with mortality in HFRS patients
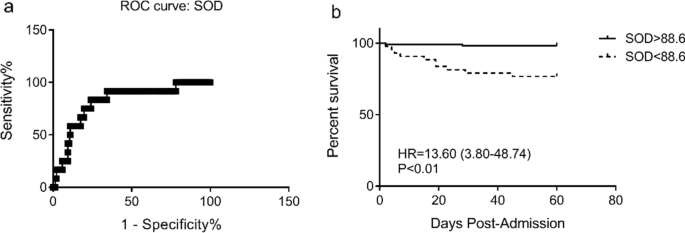
In the current cohort, among 58 patients were who classified as critical, 12 patients died. The greatest sensitivity and specificity for SOD as a predictor of death in critical HFRS patients was 88.6 U/mL, according to ROC analysis. The Kaplan–Meier analysis showed that HFRS patients with serum SOD levels < 88.6 U/mL had an increased risk of death (P < 0.01) (Fig. 3).

Kaplan–Meier analysis for survival according to admission SOD level. a ROC curve of serum SOD; b Survival of HFRS patients according to serum SOD level
Laboratory parameters in the patients during the acute stage
The levels of WBC, APTT, AST, ALT, Cre, and BUN were higher or longer than the reference values (P < 0.01), while the PLT count was lower than the reference value (P < 0.05) (Table 2). Compared with patients in the mild group and the moderate group, patients in the severe group and the critical group had lower SOD levels and higher APTT, INR and Cre levels (P < 0.05) (Table 3). Moreover, compared with the survivors, non-survivors have lower SOD levels and more elevated APTT, INR, AST, ALT, and BUN levels (P < 0.05) (Table 4).
ROC and Kaplan–Meier survival analysis
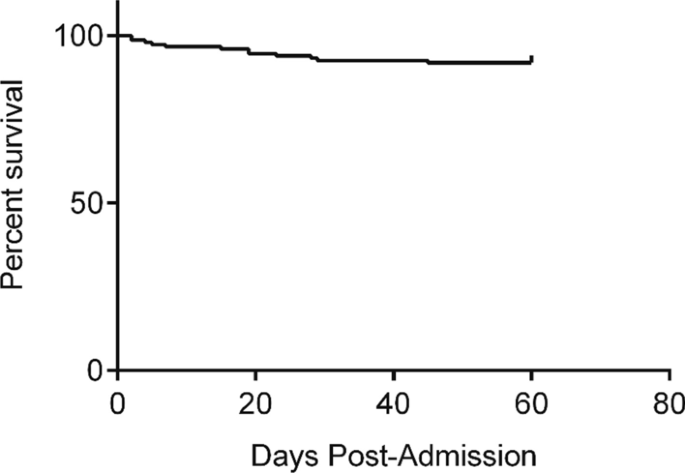
In HFRS patients, Kaplan–Meier analysis was used to determine the cumulative proportion of survivors and the 60-day death rate (Fig. 4).

Kaplan–Meier analysis for survival based on the total survival time in the period from the onset of illness to discharge or death in HFRS patients
We identified the potential risk factors in HFRS patients by using univariate and multivariate Cox regression analyses. As shown in Table 5, PLT (HR = 0.957, 95% CI: 0.921–0.995, P < 0.05), APTT (HR = 1.052, 95% CI: 1.022–1.083, P < 0.01), INR (HR = 33.315, 95% CI: 3.784–293.327, P < 0.01), AST (HR = 1.004, 95% CI: 1.001–1.007, P < 0.01), ALT (HR = 1.004, 95% CI: 1.001–1.006, P < 0.01), BUN (HR = 1.055, 95% CI: 1.005–1.108, P < 0.05) and SOD (HR = 0.946, 95% CI: 0.915–0.979, P < 0.01) were significantly associated with mortality in HFRS patients. Therefore, we performed a forward multivariate analysis. The results revealed that BUN (HR = 1.133, 95% CI: 1.032–1.243, P < 0.01), and SOD (HR = 0.918, 95% CI: 0.859–0.981, P < 0.01) were independent risk factors for mortality in HFRS patients.
ROC and area under curve (AUC) were analyzed to investigate the predictive value of BUN and SOD for prognosis in HFRS patients. AUC of BUN was much lower than that of SOD, suggesting that SOD is a better marker for predicting mortality in HFRS patients (Table 6).
Comments
Post a Comment